IKEA SSFA Dashboard

UX / UI Concept

With thousands of products and customers moving through the store daily, how can leaders and their teams more effectively keep track of commercial performance goals in the Self Serve Furniture Area (SSFA) at IKEA?

One SSFA manager in Coquitlam has taken the challenge to address this question with his idea of a desktop-based dashboard tool which compiles the KPIs of 3 main commercial areas: inspiration, profitability, and efficiency. This project conceptualizes the idea of a helpful desktop application - by aggregating multiple logistical and financial KPIs into one central, user-friendly tool, stakeholders can more efficiently and effectively steer the SSFA toward performance goals.

IKEA (Side Project)

8 Weeks

Team of 2

Desktop Application

interface example

The 3 Categories of "Community"

Efficiency

KPIs that reflect how efficient the SSFA is running, such as time it takes to move product around the SSFA and the time it takes to unload a delivery truck.

Profitability

KPIs that reflect our bottom line, such as damaged products, IKEA service offers, and stock availability.

Inspiration

KPIs that reflect our potential to inspire customers as they shop, such as furniture displays in the SSFA and the cleanliness of the department.

Challenges & Constraints

In a perfect world, the multiple KPIs of the SSFA would be linked and updated based on a system that pulls data automatically from various programs used by the business.

However, in the real world of budgets and technological timelines, the current IT situation at IKEA does not allow for this level of automation to occur. Therefore, the project had 3 main constraints:

Can't Automatically Pull Data

Because there is no way to automatically sync KPI data (as the technology not configured, and/or not in the store’s budget or timeline) users must update some or all of the information manually.

No File Saving Conventions

There’s no universal file-saving convention across the company, so users will have to locate necessary information by communicating with various stakeholders in the business.

Each Store Has Its Own Goals and Priorities

Each store decides individually what SSFA goals fit into their business plan, so users must be able to utilize the dashboard in a way that aligns with their store’s goal.

Original Experience

Using the research gathered, I created a series of tasks in order to understand how users are currently operating the SSFA; with the assumptions and constraints in mind, the tasks were structured to follow a pattern of finding the KPIs, understanding the KPI information, and sharing findings among team members. I then ran through this task list with the Assistant Manager, observing his experience as he ran through the set of tasks.

“I got close but I don’t know how to fully do it.”

“The thing that I don’t like is that everything is a file with a weird name in excel, in a million lines in excel, and picking out which is which becomes really difficult.”

“Searching through Bin Plan tools folder… I think I might have put it in here – Nope. Nope don’t remember that one either.”

observation
observation

Mapping Out Pain Points

I laid out the experience there were 6 main pain points that I began to address and extracted the project’s goals from them.

Affinity Diagram

Mapping Out Pain Points

I laid out the experience there were 6 main pain points that I began to address and extracted the project’s goals from them.

Affinity Diagram
Pain Point Goal
Finding the data for the KPI is difficult. Make data easilly accessible or learnable
Unconventional file naming Clear naming of KPIs
Outdated sharing process Simplified process of communicating with team
Data unavailable / hard to find / no access to data Streamline data entry / syncing
Arbitrary knowledge of performance goal(s) Clear comparisons to goal (where applicable)
Time consuming finding data Efficient and intuitive tool

Ideation & Sketching

During the sketching and ideation process it became apparent the hierarchy of displaying data was going to be a challenge.

The three main categories (Inspiration, Profitability, Efficiency) housed multiple KPIs, each with one or more metrics that influenced that KPI. Furthermore, each of these metrics would have to be entered in a certain format or style. Thus when designing, we began organizing the hierarchy of data as well as the various input methods necessary for each KPI.

Storyboard
Storyboard

Lo Fi Prototyping

I also came to a crossroads when considering the order of entering the information. I decided on a card system for the dashboard that would allow the following benefits:

1

Organization of high volume of data present on the dashboard

2

Quick references of what each KPI means

3

Easy acces to update each KPI individually

4

Familiarity and consistency with dashboard interfaces

Prototype 1

Update info on the back of card, click to get more info in the dialog box

Perceived benefit

Can quickly update the KPI without having to click into an extra dialog

Prototype 2

See quick info / hint on the back of card, update info in the dialog box

Perceived benefit

can quickly see what the KPI means but have to click into an extra dialgue to update

Dialog Box Layout

When clicking on an individual KPI, an important dialog box appears. As the biggest constraint of the project is the input of information, creating an intuitive way to handle data entry was paramount.

The paper prototyping outlined above proved quickly that having the information available for reference was more important than the speed of entering metrics directly. WIthout the information, the user became overwhelmed with trying to retain details of the KPI, slowing down the entry process overall. By having the update function and access to helpful information side by side, the user can quickly refer to one while utilizing the other.

wireframe
wireframe
wireframe
wireframe
wireframe
wireframe
wireframe
wireframe

Dialog Box Goals & Design

1

Keep the update function as the main priority, ensuring entering relevant information is easy for the user.

2

Provide help and guidance for the user to understand both how the metric affects the SSFA as well as where to find necessary information.

3

Have both functions present so the user can refer easily to all elements while updating the KPI.

modals
Dashboard Main

Main Overview

To reduce visual clutter while giving a full overview of the SSFA, the KPIs are reduced to their title and status. The top KPI can be shown in a more detailed view.

Main Overview

To reduce visual clutter while giving a full overview of the SSFA, the KPIs are reduced to their title and status. The top KPI can be shown in a more detailed view.

Dashboard Category

Commerciality Category Tab

Filtering each category gives a full and more detailed view of KPIs in that group, allowing the user to easily focus their efforts on understanding the health of the SSFA in relation to their store’s goals.

Commerciality Category Tab

Filtering each category gives a full and more detailed view of KPIs in that group, allowing the user to easily focus their efforts on understanding the health of the SSFA in relation to their store’s goals.

Key Dashboard Functions

Clicking the KPI card on the dashboard brings up the KPI’s dialog box. The update function is always present at the top of the window. Each KPI’s update input method includes keyboard entry, toggles, or file upload, depending on what metrics are needed.

interface example
interface example
Statistics Tab

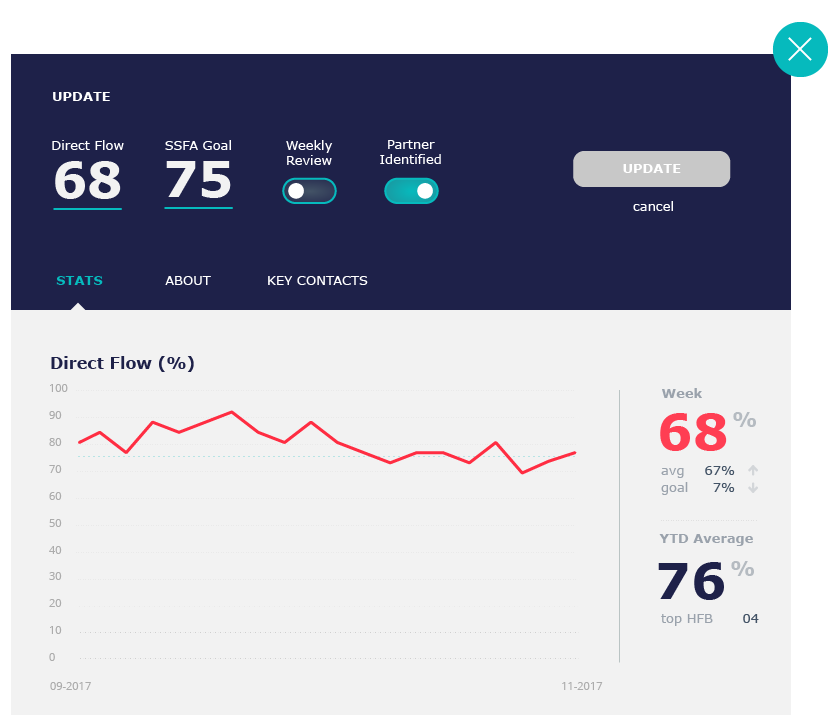
The KPI’s statistics can be found in the first tab, which displays graphical information and data. This provides a more detailed overview compared to the card on the main dashboard, which gives a small snapshot of how that particular KPI is performing.

interface example
Key Contacts Tab

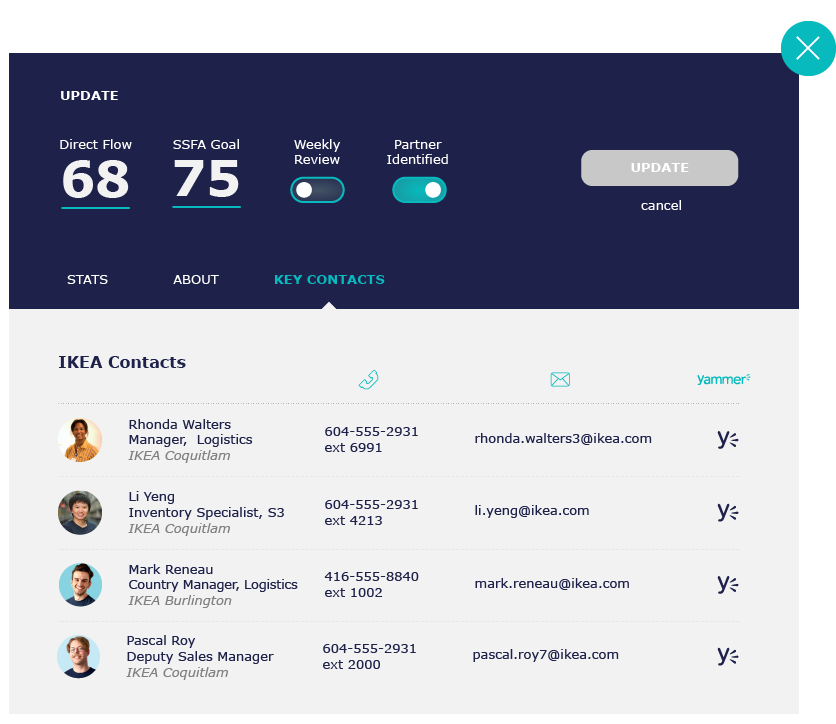
Key contacts relevant for each KPI are available for the user. This not only allows for quick reference to communicate with coworkers, but also to help the user understand their network in context with each element in the SSFA.

interface example
About Tab

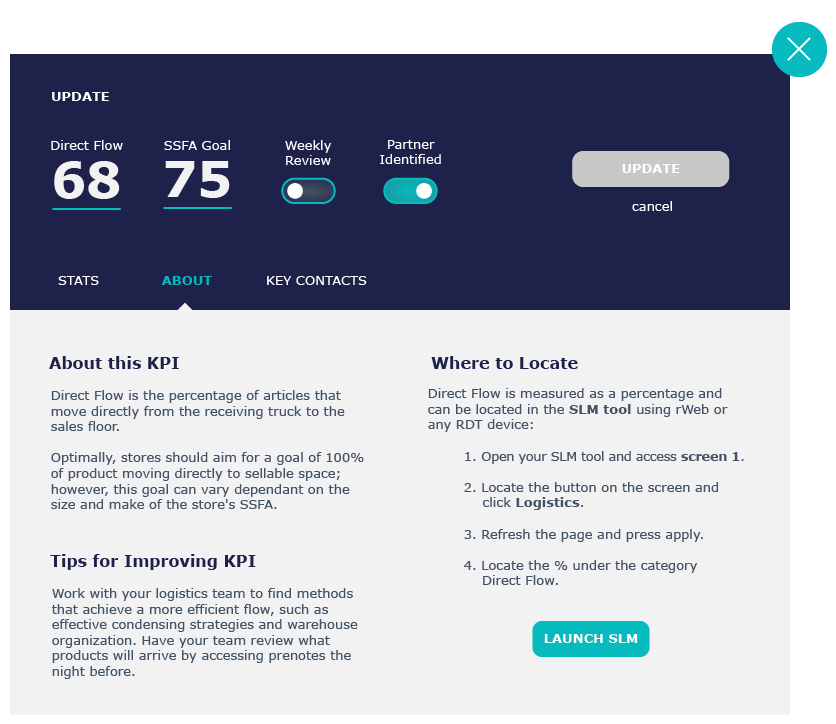
The about tab helps the user understand what each KPI is, how it impacts the business, where to find relevant information and how to update the KPI. It serves as a reference for how to both use AND understand the KPI.

interface example
Statistics Tab

The KPI’s statistics can be found in the first tab, which displays graphical information and data. This provides a more detailed overview compared to the card on the main dashboard, which gives a small snapshot of how that particular KPI is performing.

interface example
Key Contacts Tab

Key contacts relevant for each KPI are available for the user. This not only allows for quick reference to communicate with coworkers, but also to help the user understand their network in context with each element in the SSFA.

interface example
About Tab

The about tab helps the user understand what each KPI is, how it impacts the business, where to find relevant information and how to update the KPI. It serves as a reference for how to both use AND understand the KPI.

Displaying the Commerciality Graph

When first brainstorming the interface, the goal was to display a venn diagram in order to show how each category worked in relation to each other. However, after presenting a prototype to other SSFA managers in Sweden, feedback suggested that viewing the overall “health” of each category was much more beneficial to users.

Secondary Dashboard Functions

Other beneficial features to expand the dashboard concept include a way to generate reports and to share the details of each metric with other stakeholders, such as other management teams or the SSFA coworkers.

Observing the original way the SSFA Team Lead shared information proved this task was cumbersome and antiquated (taking a screenshot, pasting into Microsoft Paint, saving the file, opening email, and attaching to send). By creating ways to share KPIs and print detailed reports the user can quickly deliver information to other stakeholders.

Report
Report example
SHARE
SHARE

Concluding Thoughts & Shortfalls

Though this project was conceptual the goal is to have it implemented as an internal tool for SSFA managers and other relevant users, and currently it is still being iterated with a goal of handing it over for actual development in the future.

As the only designer working in a team of two, it’s worth noting that the limited team size can be a factor in pushing the potential of the project. However, reaching out to my peers for help and feedback with this project helped drive the scope and design at each step. I would especially like to thank Mason, UX Designer at Facebook and Eva, Product Designer at Copperleaf for their help and input.

Overall this continues to be a challenging but fun project to develop my skills in the usability field!

interface example